Cost — cost.html
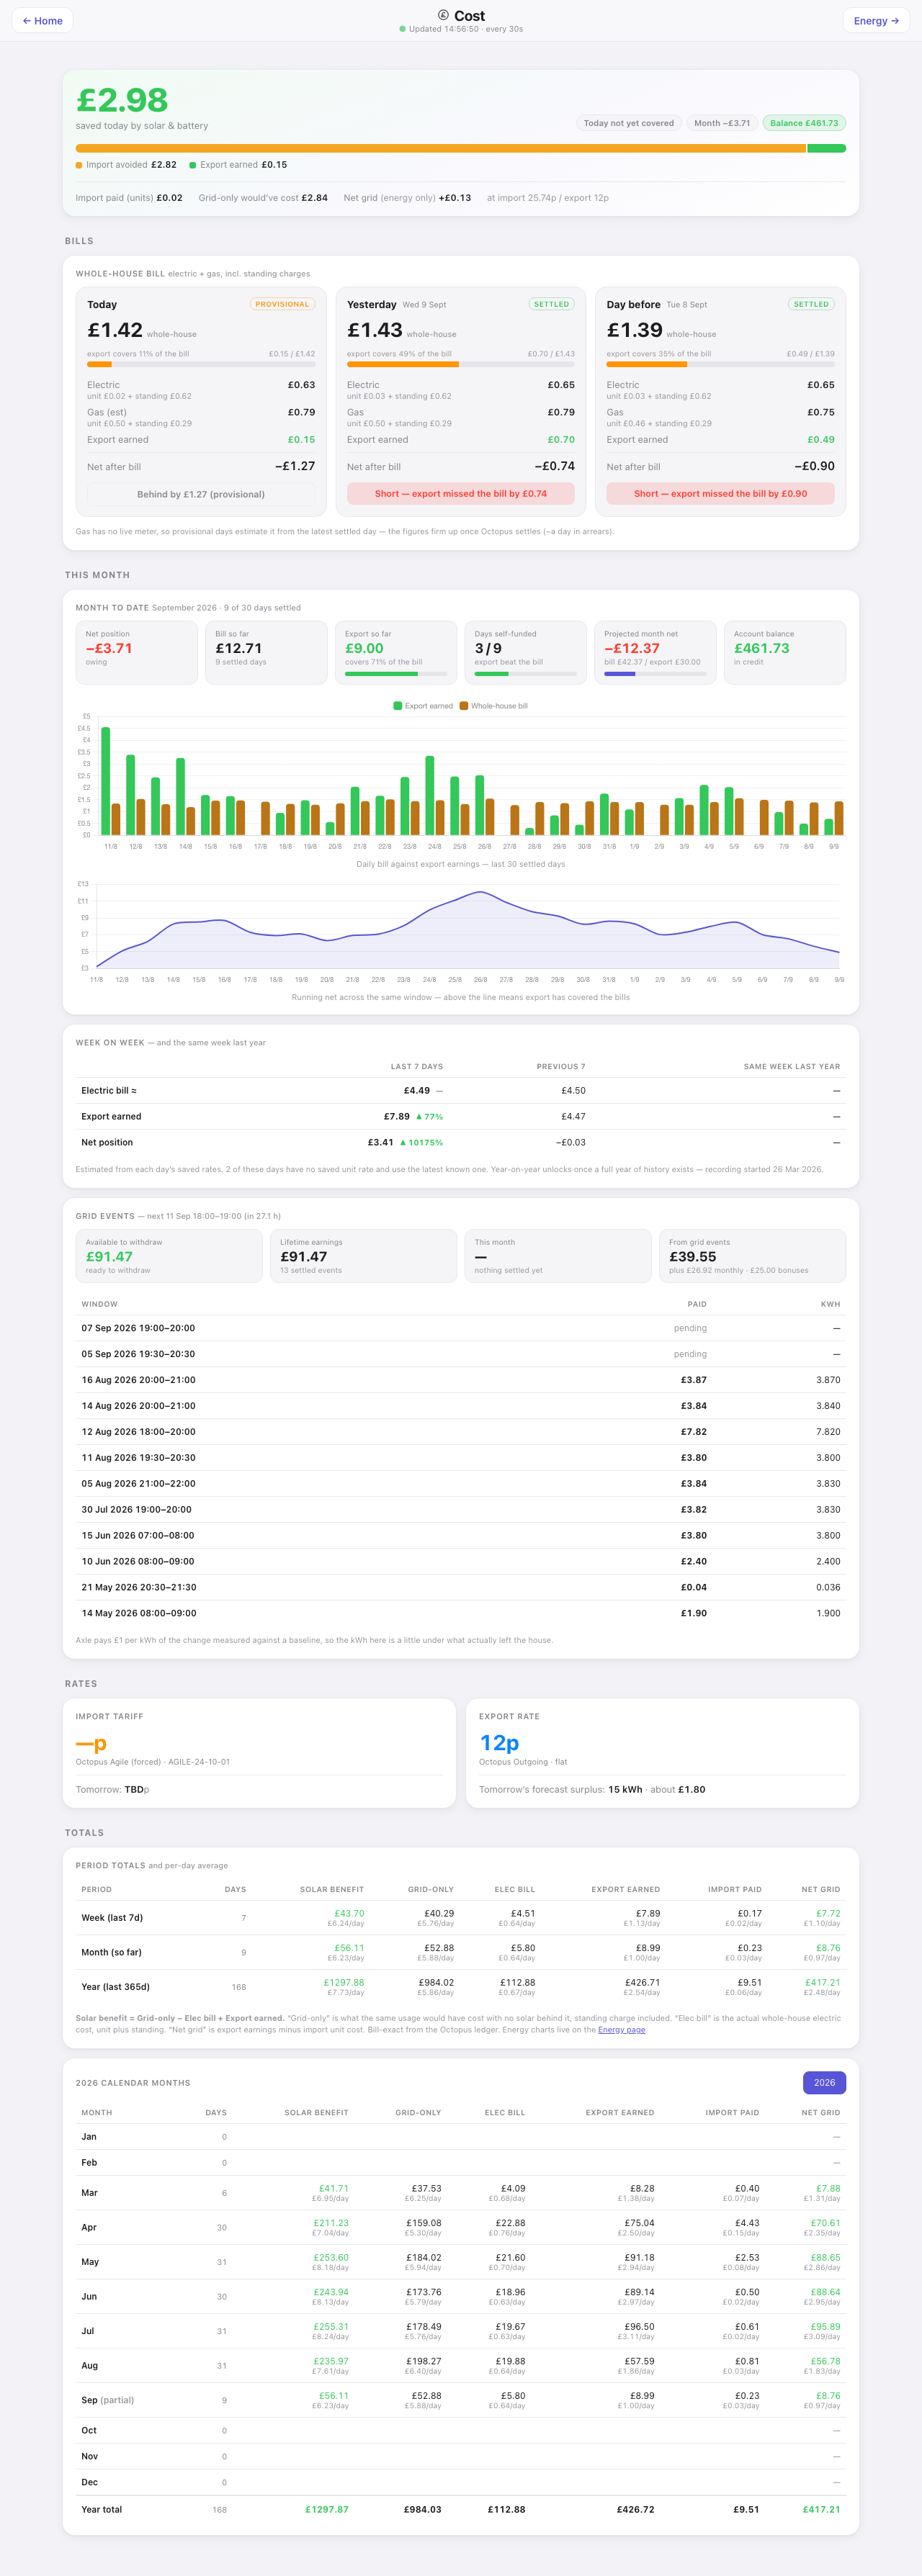
The Energy page counts kWh. This one counts pounds, and it counts them the way the bill does: electricity and gas together, standing charges included, from the supplier’s own ledger rather than a meter reading multiplied by a rate. Needs the SigenEnergyManager plugin, whose economics it reads; without it the page shows one card saying so and the menu drops its tile.
Down the page
Hero. Saved today by solar and battery, in green, with a two-colour bar splitting it into import avoided and export earned. Three pills: whether today’s bill is covered yet, the month’s net position, and the account balance. The line underneath gives import paid, what a grid-only day would have cost, net grid for energy only, and the rates in force.
Bills. Three day cards — today, yesterday, the day before — each marked provisional or settled. Every card gives the whole-house total, a bar showing what share of it export covered, electricity split into unit and standing, gas split the same way, export earned, and the net. The verdict line is in plain words: behind by an amount, on track and covering by an amount, or short because export missed the bill. The note under the row explains why provisional days move: gas has no live meter, so a provisional day estimates it from the latest settled day, and the supplier settles about a day in arrears.
This month. Net position, bill so far with the number of settled days, export so far with the share of the bill it covers, days self-funded, the projected month net, and the balance. Then two charts over the last 30 settled days: daily bill against export earnings as paired bars, and the running net as a line, where above the axis means export has covered the bills.
Week on week. Electric bill, export earned and net for the last seven days against the previous seven and the same week last year, with the percentage change.
Grid events. Where the energy plugin takes part in demand-response events: available to withdraw, lifetime earnings, this month, and earnings from events alone, then every window announced or settled, newest first, with what it paid and how many kWh it counted. A pending window shows a dash rather than a guess.
Rates. Import tariff with the product and tomorrow’s rate and direction; export rate with tomorrow’s forecast surplus and what it is worth.
Totals. Week, month and year, each with days, solar benefit, grid-only cost, electric bill, export earned, import paid and net grid, with a per-day average under every figure. The note underneath defines each column — worth reading once, because “solar benefit” is a derived number: grid-only minus electric bill plus export earned.
Calendar months. Every month of the current year with the same columns, the partial month marked as such, and a year total. A year selector sits top right.
Where the numbers come from
sigenApi, the same proxy as the Energy page, reading SigenEnergyManager’s economics — which are themselves built from the supplier’s ledger, so the figures are bill-exact.
Refresh
Every 30 s for the live hero, hourly for the settled history. The header states the cadence.
What you can do here
Read it, switch the calendar year, and follow the link back to the Energy page. No controls.
Worth knowing
- Provisional and settled are not cosmetic. A provisional day’s gas is an estimate and will move; a settled day will not.
- “Short — export missed the bill” means the day’s export earnings did not cover the whole-house bill, which on a flat export rate is a statement about the weather rather than the tariff.
- Solar benefit compares against a grid-only counterfactual with the standing charge included, so it is not the same figure as “money saved” on any other page. The definitions note is there because the four money numbers on this page are all subtly different.