Energy — energy.html
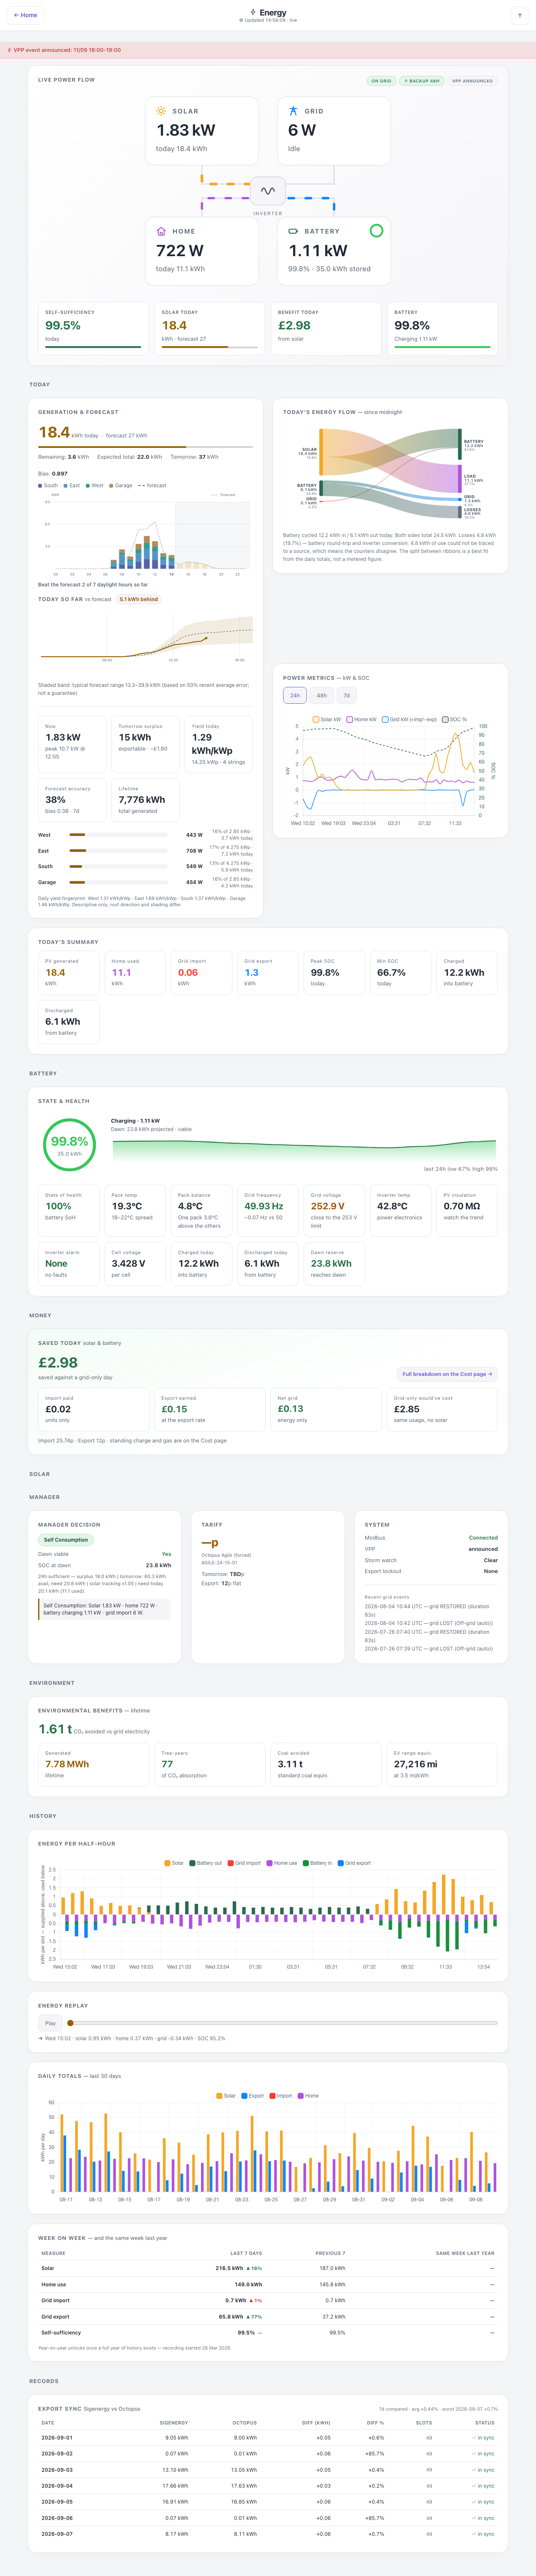
Everything the solar and battery system knows, on one long page in labelled bands. The hub’s energy card is the summary; this is the whole thing. Needs the SigenEnergyManager plugin. Without it the page shows one card saying so, the menu drops its tile and the hub hides its energy card; nothing else on the dashboards depends on the plugin.
Down the page
VPP banner. When the energy plugin has a demand-response event announced but not started, a full-width strip under the header says so, and the status pills carry a matching chip.
Live power flow. The same diagram as the hub, larger, with status pills top right: grid state, days of backup at the current draw, and the inverter’s working mode. Solar, grid, home and battery each show instantaneous watts and today’s running total; the battery also shows percentage and kWh stored. Four tiles under it: self-sufficiency today, solar today against forecast, benefit today, and battery state of charge with what it is doing.
Today. A Sankey of where every kWh since midnight came from and went, with a note stating the round-trip loss and warning that the two sides disagree by that amount, because the split is a best fit to the daily totals and not a metered figure. Beside it, power metrics — solar, home, grid and state of charge on one chart with 24 h / 48 h / 7 d buttons; grid is signed, import positive.
Today’s summary. Plain tiles: generated, used, imported, exported, peak and minimum state of charge, charged into and discharged from the battery.
Battery. A ring for state of charge, what it is doing now in kW, the projected dawn state of charge with a viability verdict, and a 24 h sparkline. Then a grid of tiles: state of health, pack temperature with the cell spread, pack balance, grid frequency and voltage banded against the statutory range (the limit comes from the plugin, never hardcoded), inverter temperature, PV insulation resistance shown with no verdict because the manufacturer’s threshold is not public, the inverter’s own alarm state, cell voltage, today’s charge and discharge, and the dawn reserve. A tile that cannot know does not appear. Then the battery fleet: every battery in the house, the house pack by percentage and any vehicle monitors from the configuration by voltage, with a frozen-reading check.
Money. Saved today from solar and battery against what a grid-only day would have cost, with import paid, export earned and net grid, and a link across to the Cost page for the full breakdown. Energy only: standing charges and gas live on the Cost page.
Solar. Today’s kWh against forecast with a progress bar, remaining, expected total, tomorrow and the forecast bias. Then the stacked hourly chart: elapsed hours as per-array actuals, each with a dashed forecast tick at the height it was promised — a stack topping or missing its tick is the beat-or-miss verdict, drawn as geometry rather than colour so it survives colour-blindness — and a scoreboard line counting it. Future hours are pale forecast bars. Where a past hour has no history it stays a gap rather than becoming a fabricated zero. Below that a cumulative chart, solid for banked so far and dashed for the corrected forecast, with an ahead / behind / on-forecast chip; then tiles for now, tomorrow’s surplus, yield per kWp, forecast accuracy and lifetime generation; then a per-array strip with each array’s share of its own rating, live watts and kWh today.
Manager. What the energy plugin is deciding and why: the current mode, whether dawn is viable, the projected dawn state of charge and the reasoning in the plugin’s own words; the tariff, with tomorrow’s rate and direction; and the system card — connection, VPP state, storm watch, export lockout, and a short log of recent grid events.
Environment. Lifetime CO₂ avoided, expressed several ways.
History. Energy per half-hour as a stacked chart above and below the axis — supplied above, used below. Then daily totals for the last 30 days, then week on week against the previous week and the same week last year (the year-on-year column stays empty until a full year exists, and says so).
Records. Export sync — the plugin’s own reading against the supplier’s, day by day, with the difference and an in-sync verdict.
Where the numbers come from
Almost all of it arrives through one endpoint: sigenApi, the plugin’s server-side proxy to SigenEnergyManager’s data API. It is a proxy rather than a direct call so the page works away from home as well as on the LAN — the browser never needs to reach the energy plugin itself. The path is allow-listed and the upstream host is fixed.
The stacked hourly chart is the exception: it reads solarStringHours, which integrates per-hour per-array kWh out of the SQL Logger history, PK-ranged and cached, and returns null for an hour with no samples so the page falls back rather than inventing zeros.
Refresh
- Live flow and status every 5 s.
- Charts and summaries every 20 s.
- Half-hourly history every 5 minutes.
- Daily totals every 30 minutes.
- The lifetime and records blocks hourly.
What you can do here
Nothing — it is entirely read-only. Control of the battery lives in the energy plugin itself. The only interactions are the chart range buttons and the link to the Cost page.
Worth knowing
- The Sankey’s note about the two sides disagreeing is not a bug being apologised for. The split is fitted to the daily totals, so it is a picture of the day rather than a meter reading.
- Forecast accuracy compares the day’s forecast against what arrived, so a low number after an unusual sky is the forecast being wrong rather than the array underperforming.
- The manager’s reasoning line is worth reading before wondering why the battery is doing what it is doing. It says which of the plugin’s rules is currently in charge.